A Visit to the William J. Hughes Technical Center
At the Heart of Airfield Pavement Research
Most of my research happens in an office, where pavement features are arrays, aircraft are gear configurations, and "damage" is computed before it even happens. Although abstractions are powerful, sometimes it makes you feel like that data came out of nowhere. Our visit to the Federal Aviation Administration's (FAA) William J. Hughes Technical Center in New Jersey was a deliberate effort to connect our data processing and modeling work to the physical reality that produced the signals we were trying to learn patterns from. This trip was part of ICT R27-203: Building Machine-Learning-Based Prediction Models for Computationally Efficient Airfield Pavement Analysis, a project that (in plain terms) was about making mechanistic airfield pavement analysis far faster using machine learning algorithms, without losing the engineering accuracy behind the results. The core goal of the visit was simple: familiarizse ourselves with the data we were dealing with by seeing how it was actually generated, measured, and stored.
A brief text about the image
Large-Scale Testing
The FAA's William J. Hughes Technical Center houses the National Airport Pavement Test Facility (NAPTF), a fully enclosed, full-scale accelerated pavement testing facility where airfield pavements are subjected to simulated aircraft traffic. We were able to stand in a world-class facility built specifically to run controlled, repeatable cycles of aircraft loading into pavement structures.
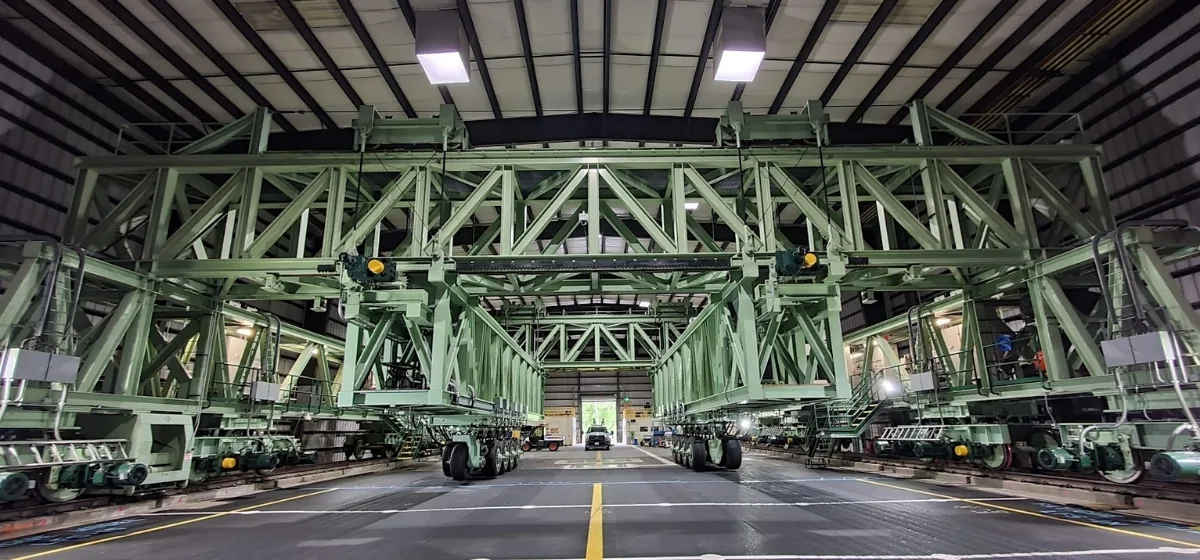
The 5340 kN Testing Machine spans two sets of railway tracks that are 23.2m apart. The vehicle has adjustable dual-wheel loading modules.
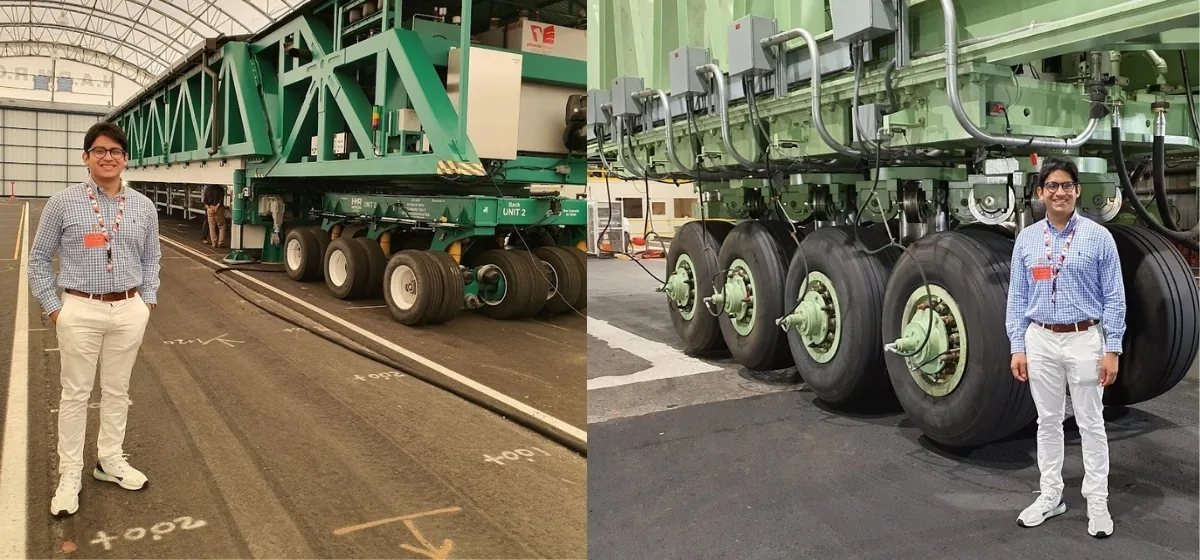
The NAPTF setup revolves around a rail-based airfield pavement test vehicle designed to simulated aircraft landing gear loads across instrumented sections. The test vehicle consists of two carriages (north and south), and each carriage can be configured with up to ten wheels, allowing for a wide range of loading configurations (see Figure 2). The wheels are mounted on a mechanism that allows vertical movement to simulate landing gear dynamics. During our visit, we observed live testing of a Construction Cycle. In a Construction Cycle, pavement layers are built to specification, trafficked under defined loading, monitored through failure (or a target condition) to track distress progression, and the results are archived into a structured database.
What stuck with me was the scale of the gears. The tires were almost human-sized (see Figure 3). On the technical side, I was impressed by the level of instrumentation embedded in the pavement sections. Strain gauges, pressure cells, thermocouples, and displacement transducers were all connected to a central data acquisition system that recorded high-frequency measurements during each loading pass. The FAA pavement testing and instrumentation workflow captured pavement responses triggered by loading events and recording time histories for sensors. The data collected here is the backbone of distress model development.
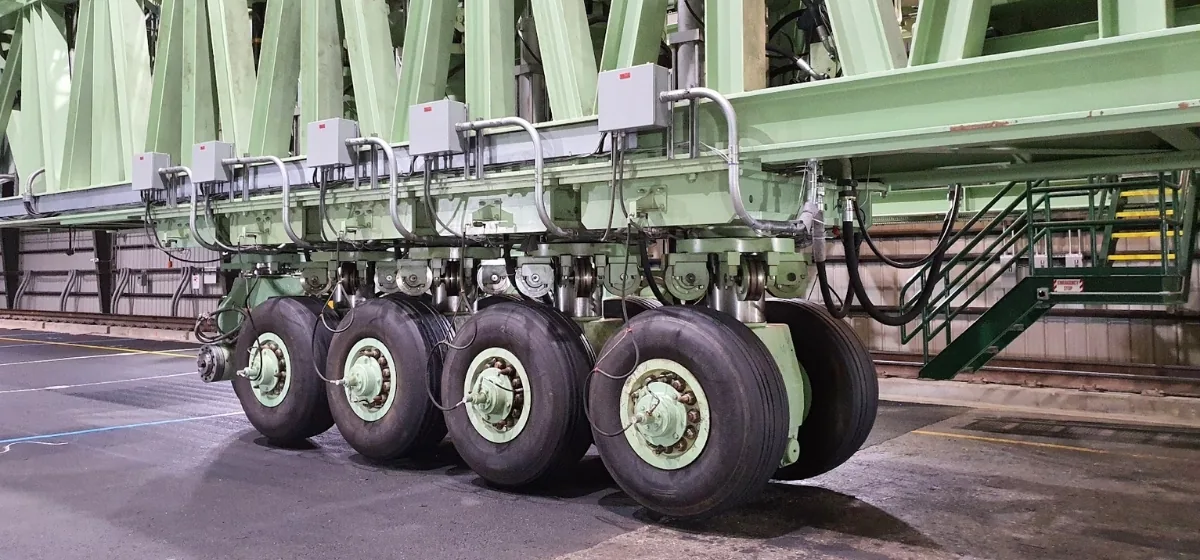
5-dual wheel configuration landing gear
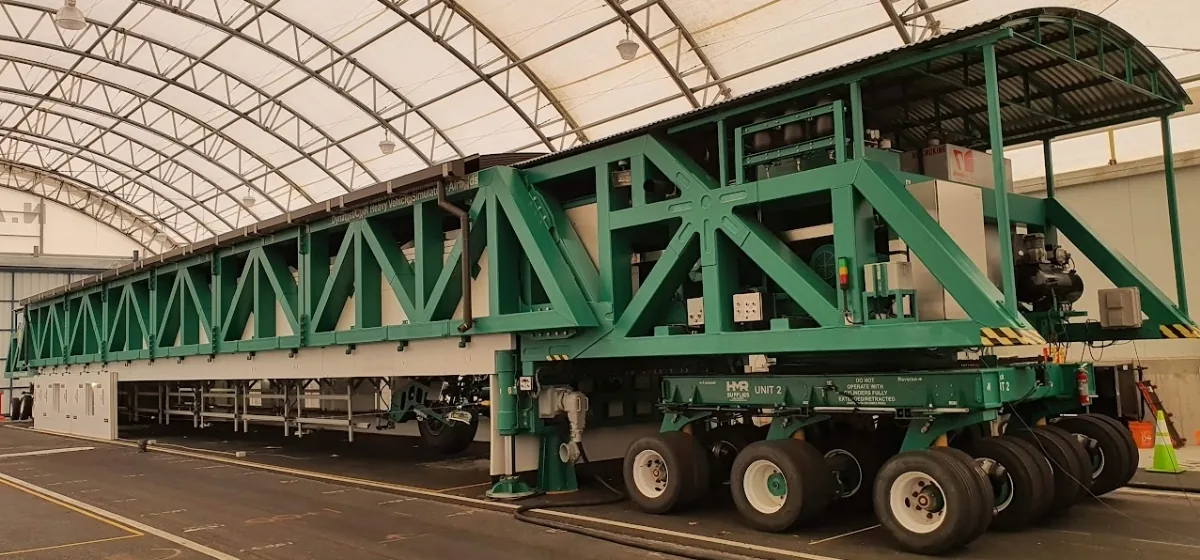
HVS-A is part of the National Airport Pavement and Materials Research Center (NAPMRC)
If the NAPTF reassembles controlled aircraft trafficking inside a hangar, the Heavy Vehicle Simulator (HVS-A) is its outdoor counterpart (see Figure 4). HVS-A is a mobile pavement testing platform that can be driven to different locations to conduct in-situ pavement testing under realistic environmental conditions. It can replicate high pavement temperatures using an automated heating system. HVS-A is equipped with a single dual-wheel loading module capable of applying loads up to 240 kN. It can simulate temperatures up to roughly 150°F (65°C), and low-speed trafficking (up to 5mph). Unfortunately, we didn't get to see HVS-A in action. The deeper reason for the trip, though, was not sightseeing the favilities, but delivering a project progress presentation to the FAA management, specifically Dr. Navneet Garg, covering where we were, how the project's direction had shifted, and how we planned to complete what remained.
Other Active Experiments
Beyond the trafficking testing, we also got a close look at other ongoing activities, specially how distress progression is monitored. We visite one active effort of crack monitoring on the NAPTF test lanes, and observed rutting evaluation on a visibly failed section. The common ground across both activities was traceability. Every crack was marked, every rut depth measured, and every observation recorded to later be tied back to the loading history and pavement response data.
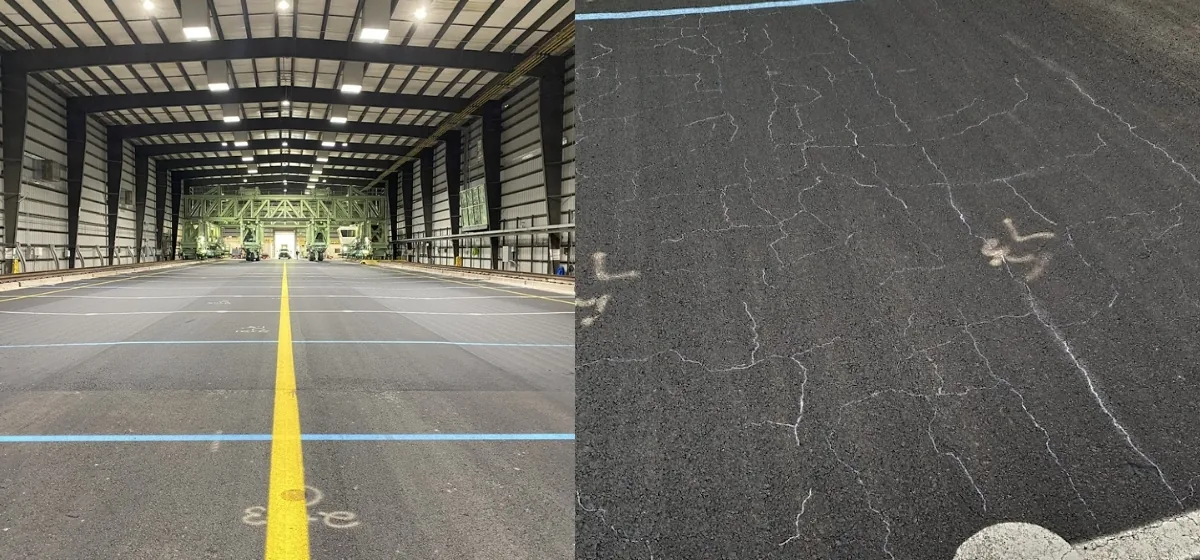
Cracks are marked for monitoring and analysis purposes.
Seeing a cracked test section from the ground level makes it obvious why accelerated pavement testing is so valuable. You get to observe how a crack evolves under controlled loading. Cracks were clearly marked and indexed directly on the surface (paint labels and reference marks), turning the pavement into a map (see Figure 5). The marking enforces repeatability. When you come back after additional load passes, you are tracking the same feature, the same location, across time. That is what makes progression rates, crack connectivity, and spatial patterns usable as ground truth data for model development.
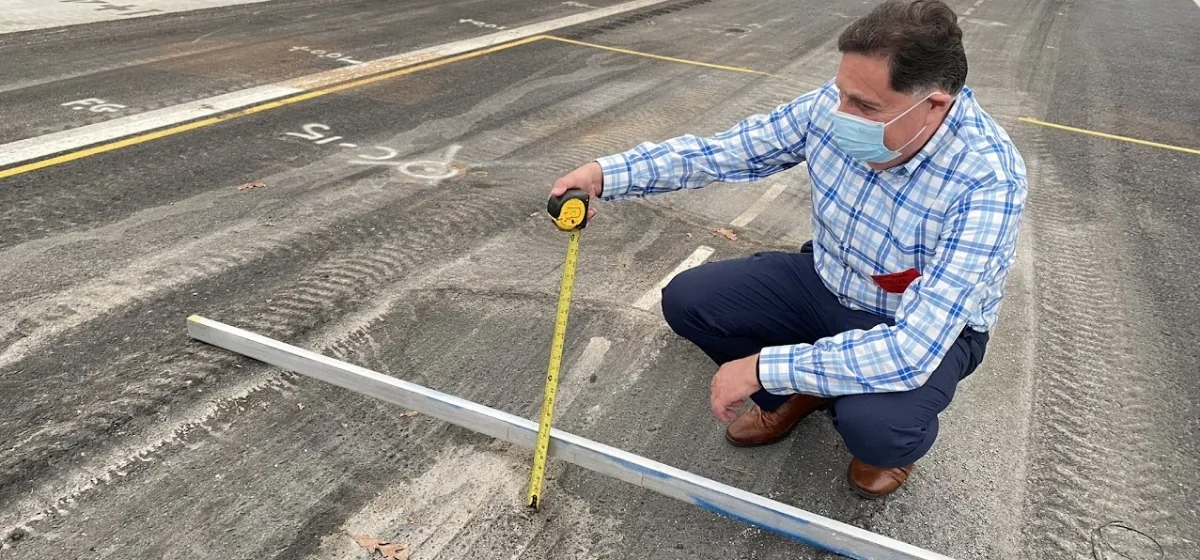
Prof. Al-Qadi measures on field the rut depth of a failed section
For rutting evaluation, a straightedge was placed across the wheel path and the rut depth was measured manually with a tape. That measurement is a snapshot of permanent deformation. It's also a nice reality check for a numerical model. Because rutting is not just the result of one mechanism, we could be looking at shear flow in asphalt layers, mix instability, or even contributions from underlying layers depending on the structure and temperature. Prof. Al-Qadi could not resist the temptation to measure the rut depth himself (see Figure 6).
Final Thoughts
Coming back from the Technical Center, our project felt more like what it actually was: translating full-scale experimental physics into computational tools that could be fast enough to be usable. The NAPTF and HVS-A were not built to prove a theory, but to generate data that could be used to build distress models with generalization potential.
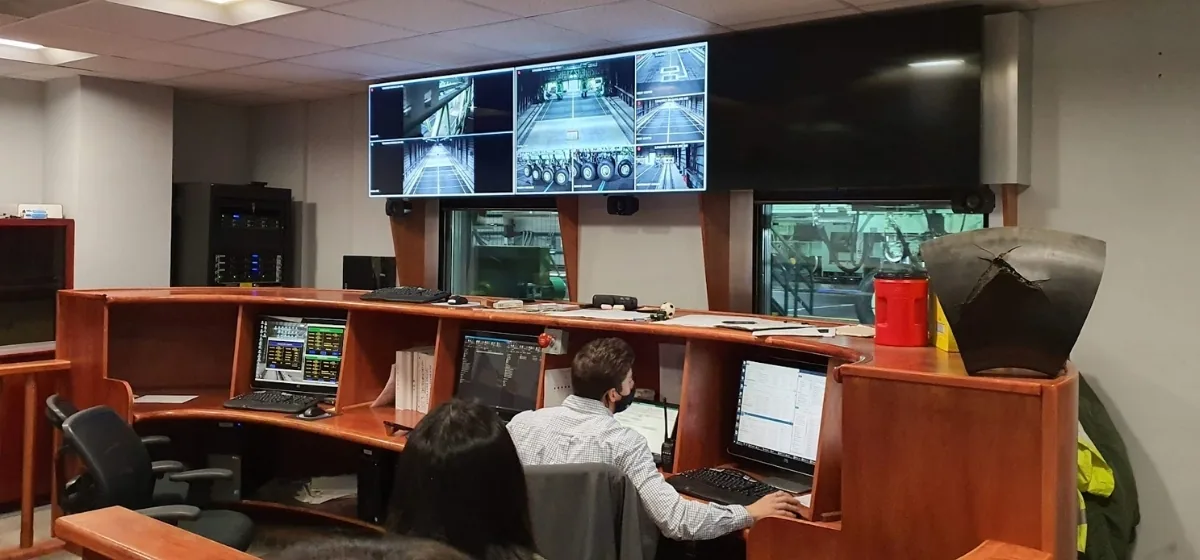
On a personal reflection, the control room, with people monitoring the system live, coordinating tests, maintaining instrumentation designing experiments, reminded me that research is a collective machine. In that context, our numerical models are one small gear in a much bigger assembly. When you finally get to see the physical scale of the testing (the hardware, loading system, instrumentation, etc), you can't help but want your piece of the system to be worthy of the rest. Reliable enough so that someone else can trust it when the stakes are real.
The coolest machine in pavement research, and two simulators